はじめに
機器の温度や通信状況等を監視したかったため、
Grafana Cloud と Prometheus を利用して、
いい感じのダッシュボードを作りました。
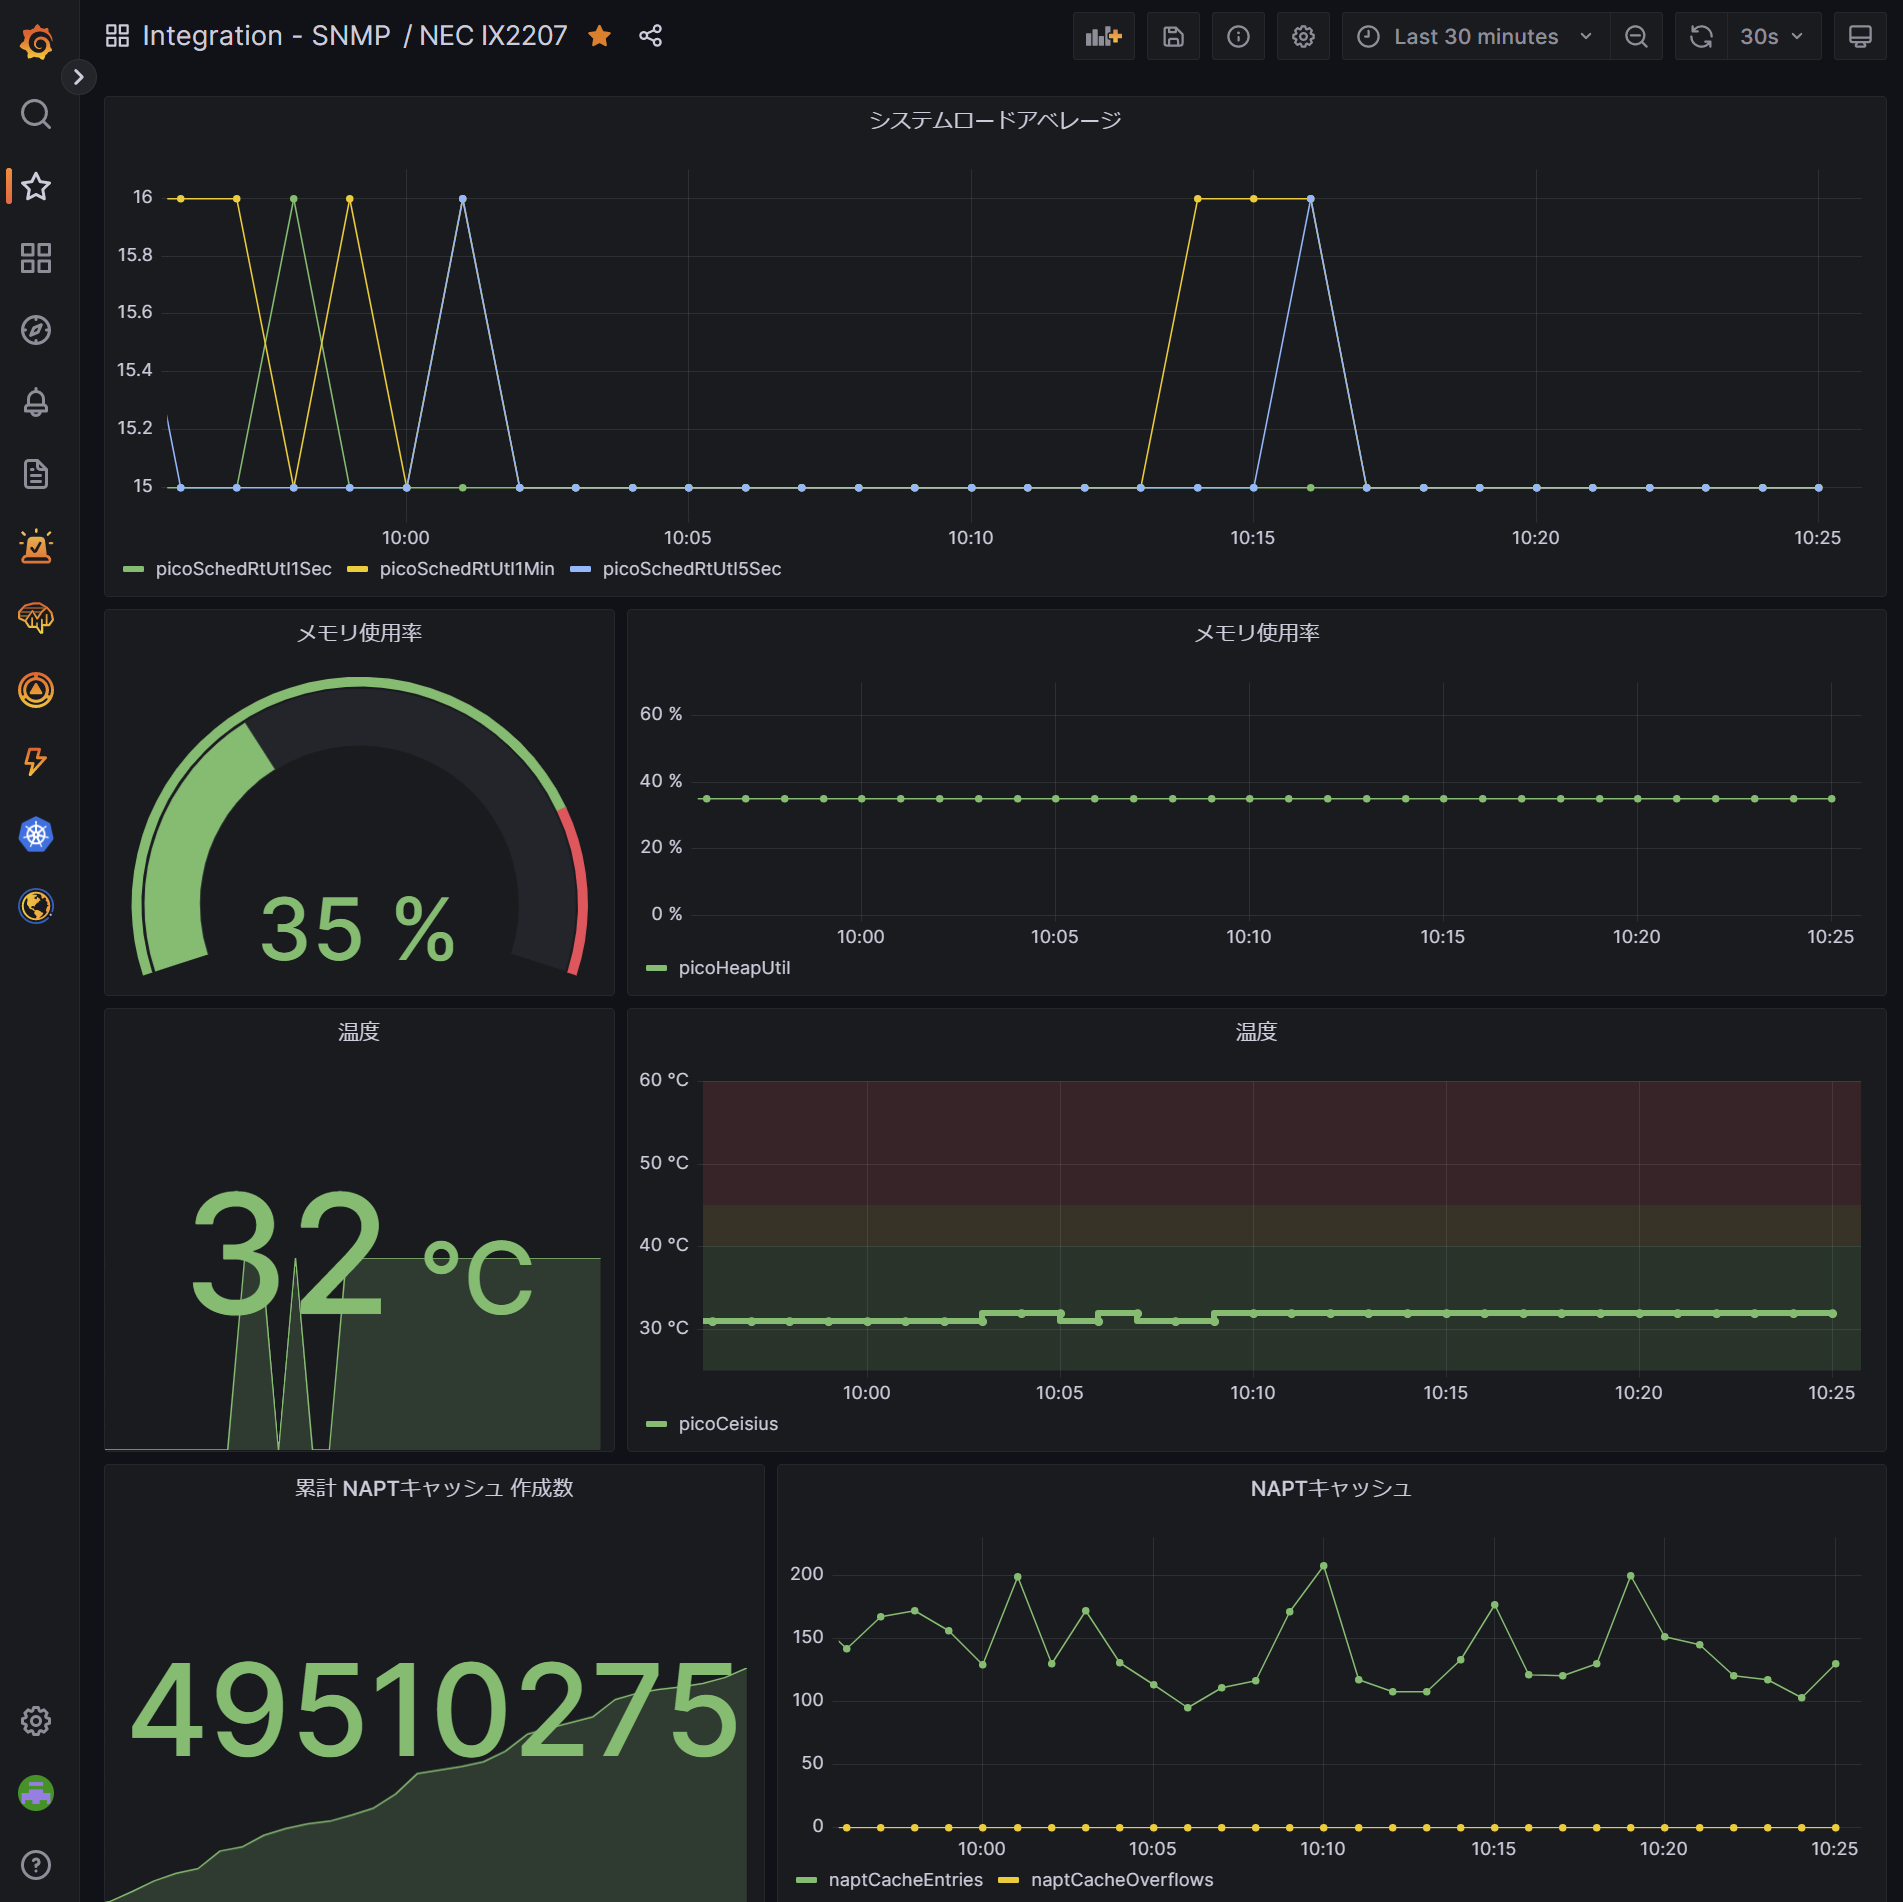
できあがったもの
NEC の FAQと機能説明書等を参考にしました。
- CPU 使用率
- メモリ使用率
- 温度
- NAPT キャッシュ
流れ
自前で Prometheus と Grafana を構築しても良かったのだけれでも、
Grafana Labs が運営している Grafana Cloud を利用しました。
自前 Grafana と違う点は Grafana Agent が対象のデータを収集し、
Grafana Cloud に転送することです。
ちなみに Grafana Cloud は無料で利用できますが、以下の制約があります。
- 利用ユーザー数 3 人まで
- 10,000 までのメトリクス
- 50GB までのログ
- 14 日間のメトリクスの保存
NEC IX の設定
snmp-agent ip enable
snmp-agent ip community public
snmp_exporter のジェネレーター
generator.ymlに以下を追記する。
...
  nec_ix:
    walk:
      - picoSystem
      - picoIpSecFlowMonitorMIB
      - picoExtIfMIB
      - picoNetworkMonitorMIB
      - picoIsdnMIB
      - picoNgnMIB
      - picoMobileMIB
      - picoIPv4MIB
      - picoIPv6MIB
+     - picoOriginal
+     - picoLoginMIB
+     - picoConfigEventMIB
+     - picoPostMIB
+     - picoQoSMIB
+     - picoNAPTMIB
...
その後、SNMP Exporter Config Generatorを参考にコンフィグを生成。
Grafana Agent
先程生成したコンフィグファイルのパスをconfig_fileに記述する。
integrations:
  prometheus_remote_write:
    - basic_auth:
        password: <password>
        username: <username>
      url: <url>
  snmp:
    enabled: true
    relabel_configs:
      - action: replace
        regex: (^.*snmp)\/(.*)
        replacement: $1
        source_labels:
          - job
        target_label: job_snmp
      - action: replace
        regex: (^.*snmp)\/(.*)
        replacement: $2
        source_labels:
          - job
        target_label: snmp_target
    snmp_targets:
      - address: 192.168.10.254
        module: if_mib
        name: NEC_IX2207 if_mib
        walk_params: public
      - address: 192.168.20.254
        module: if_mib
        name: Allied_X51028GTX if_mib
        walk_params: public
      - address: 192.168.10.254
        module: nec_ix
        name: NEC_IX2207 nec_ix_mibs
        walk_params: public
    walk_params:
      public:
        auth:
          community: <community>
        version: 2
    config_file: /etc/snmp.yml # カスタムsnmpコンフィグファイル パス
logs:
  configs:
    - clients:
        - basic_auth:
            password: <password>
            username: <username>
          url: <url>
      name: integrations
      positions:
        filename: /tmp/positions.yaml
      target_config:
        sync_period: 10s
metrics:
  configs:
    - name: integrations
      remote_write:
        - basic_auth:
            password: <password>
            username: <username>
          url: <url>
  global:
    scrape_interval: 30s
  wal_directory: /tmp/grafana-agent-wal